About Trendline Charts
**Announcement: Market Data Source has been fixed, v3.86. Trendline Charts (v3.0) by Screenulator.com (R) What's new on V3.0: - Interactive Charts, touch info display, scroll, zoom - Intraday charts and trendlines
**Announcement: Market Data Source has been fixed, v3.86.
Trendline Charts (v3.0) by Screenulator.com ®
What's new on V3.0:
- Interactive Charts, touch info display, scroll, zoom
- Intraday charts and trendlines
- Indicator window: RSI, MACD, SMA, EMA, Bollinger, Keltner, Donchian band, Ichimoku Cloud, Parabolic SAR, McGinley Dynamic, SuperTrend, stochastic, ADX, Aroon, Chaikin, Ultimate, MFI, OBV, ATR, ADL, CCI indicators. Fibonacci Retracement and text annotation tools
- FOREX pairs supported
- RSS News feed
Summary:
The only stock chart app to automatically display Support and Resistance lines (also known as Trendlines) on a Candlestick chart, powered by Screenulator.com chart pattern recognition AI algorithms. It also has a filter or stock screener based on Trendline patterns, such as Resistance breakout and Support penetration. For example, you can see all the stocks that have broke out resistance levels at a glance.
By using Deep Learning Neural Networks, the effectiveness and profitability of automated trendlines have been backtested with over 50+ years of historical big data.
About Trendlines:
A trend line is a bounding line for the price movement of a security. A support trend line (or a bottom line) is formed when a securities price decreases and then rebounds at a pivot point that aligns with at least two previous support pivot points. Similarly a resistance trend line (or a top line) is formed when a securities price increases and then rebounds at a pivot point that aligns with at least two previous resistance pivot points. In other words, bottom lines are formed by joining a series of bottom points, and top lines are formed by joining a series of peaks.
Trendlines are considered by many expert traders and investors as the single most important tools in technical analysis. However, unlike other indicators of Technical Analysis, it does not come with a fixed formula, but require human eyes and brain to draw the best fit line across a series of bottoms or tops. It is still very much of an art form. If you are looking for a particular trendline pattern - such as Resistance breakout, the tasks of drawing trendlines for all stocks on the market becomes tedious if not impossible. This tool solves the problem for you.
Stock screeners based on trendline patterns include: Resistance (topline) breakout, Support (bottom line) penetration, Channels (both top and bottom line), Wedge (Consolidation pattern bounded by top and bottom lines), near Support level, near Resistance level. The screening results are updated daily and individual stock charts and automatic trendline drawing is done instantaneously in real time.
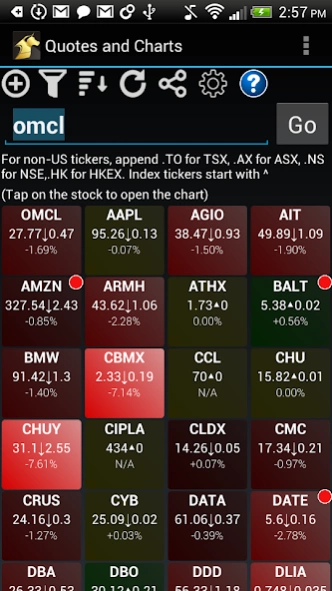
For non-US tickers, append .TO for TSX, .AX for ASX, .HK for HKEX. Index tickers start with ^
- Candlestick charting for all stocks in 16 markets worldwide, 19000+ symbols
- All Forex pairs
- Supported markets: NASDAQ, NYSE, AMEX, TSX, Asia: HKEX, Australia, New Zealand, India (NSE), JKSE, Shenzhen, Shanghai, Singapore, Europe: London, Paris, Brussels, Amsterdam, Milan, Athens
- Advanced chart pattern recognition engine to display trendlines overlay
- Stock screeners based on trendline patterns, updated daily
- Check out more advanced technical analysis tools at www.Screenulator.com!
Trendline colors: http://www.screenulator.com/cgi-bin/v?pid=faq
Keywords: Stock charts, Trend line, trendlines, automated chart pattern detection
Previous Versions
Here you can find the changelog of Trendline Charts since it was posted on our website on 2019-10-25 11:11:51.
The latest version is 3.98 and it was updated on 2024-04-22 10:46:42. See below the changes in each version.
Trendline Charts version 3.98
Updated At: 2020-05-26
Changes: Stock market data set update, default portfolio update. Realtime intraday chart streaming.
Trendline Charts version 3.97
Updated At: 2019-05-21
Changes: Fix US Intraday Data
Disclaimer
Official Google Play Link
We do not host Trendline Charts on our servers. We did not scan it for viruses, adware, spyware or other type of malware. This app is hosted by Google and passed their terms and conditions to be listed there. We recommend caution when installing it.
The Google Play link for Trendline Charts is provided to you by apps112.com without any warranties, representations or guarantees of any kind, so access it at your own risk.
If you have questions regarding this particular app contact the publisher directly. For questions about the functionalities of apps112.com contact us.